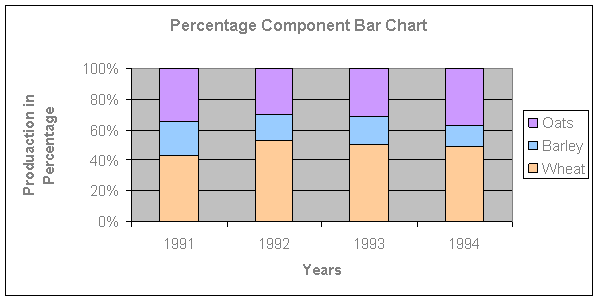
Percentage Component Bar Chart
A sub-divided bar chart may be drawn on a percentage basis. To draw a sub-divided bar chart on a percentage basis, we express each component as the percentage of its respective total. In drawing a percentage bar chart, bars of length equal to 100 for each class are drawn in the first step and sub-divided into the proportion of the percentage of their component in the second step. The diagram so obtained is called a percentage component bar chart or percentage stacked bar chart. This type of chart is useful to make comparisons in components holding the difference of total constants.
Example:
The table below shows the quantity in hundred kgs of wheat, barley and oats produced in a certain form during the years 1991 to 1994.
|
Years
|
Wheat
|
Barley
|
Oats
|
|
1991
|
34
|
18
|
27
|
|
1992
|
43
|
14
|
24
|
|
1993
|
43
|
16
|
27
|
|
1994
|
45
|
13
|
34
|
Construct a percentage component bar chart to illustrate this data.
Solution:
The necessary computations for the construction of a percentage bar chart given below:
|
Item
|
1991
|
1992
|
1993
|
1994
|
||||
|
|
%
|
Cum%
|
%
|
Cum%
|
%
|
Cum%
|
%
|
Cum%
|
|
Wheat
|
43.0
|
43.0
|
53.1
|
53.1
|
50.0
|
50.0
|
48.9
|
48.9
|
|
Barley
|
22.8
|
65.8
|
17.3
|
70.4
|
18.6
|
68.6
|
14.1
|
63.0
|
|
Oats
|
34.2
|
100
|
29.6
|
100
|
31.4
|
100
|
37.0
|
100
|
|
Total
|
100
|
|
100
|
|
100
|
|
100
|
|
- % indicates the percentage of each item
- Cum% indicates the cumulative percentage
Percentage Component Bar Chart