Linear Inequalities in Two Variables
The inequalities of the form $${\text{ax}} + {\text{by}} > {\text{c}}$$, $${\text{ax}} + {\text{by}} \leqslant {\text{c}}$$, $${\text{ax}} + {\text{by}} \geqslant {\text{c}}$$, where $${\text{a}} \ne 0$$, $${\text{b}} \ne 0$$, c are constants, are called the linear inequalities in two variables.
The points $$\left( {{\text{x}},{\text{y}}} \right)$$ which satisfy the linear inequality in two variables, ‘x’ and ‘y’ from its solution.
Graphing the Solution Region of Linear Inequality in Two Variables
Example:
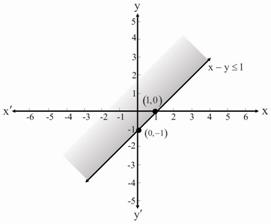
Graph the solution set of the linear inequality $${\text{x}} – {\text{y}} \leqslant 1$$ in xy–plane.
Solution:
We have
\[{\text{x}} – {\text{y}} \leqslant 1\,\,\, – – – \left( A \right)\]
The corresponding equation of inequality A
\[{\text{x}} – {\text{y}} = 1\,\,\, – – – \left( i \right)\]
For x–intercept:
Put $${\text{y}} = 0$$ in equation (i)
\[\begin{gathered} {\text{x}} – \left( {\text{0}} \right) = 1 \\ \Rightarrow {\text{x}} = 1 \\ \therefore \left( {1,0} \right) \\ \end{gathered} \]
For y–intercept:
Put $${\text{x}} = 0$$ in equation (i)
\[\begin{gathered} {\text{0}} – {\text{y}} = 1 \\ \Rightarrow {\text{y}} = – 1 \\ \therefore \left( {0, – 1} \right) \\ \end{gathered} \]
Test:
Put origin $$\left( {0,0} \right)$$ in equation (A)
\[\begin{gathered} 0 – 0 < 1 \\ \Rightarrow 0 < 1 \\ \end{gathered} \]
Which is true.
The solution set of inequality lies on the origin side.